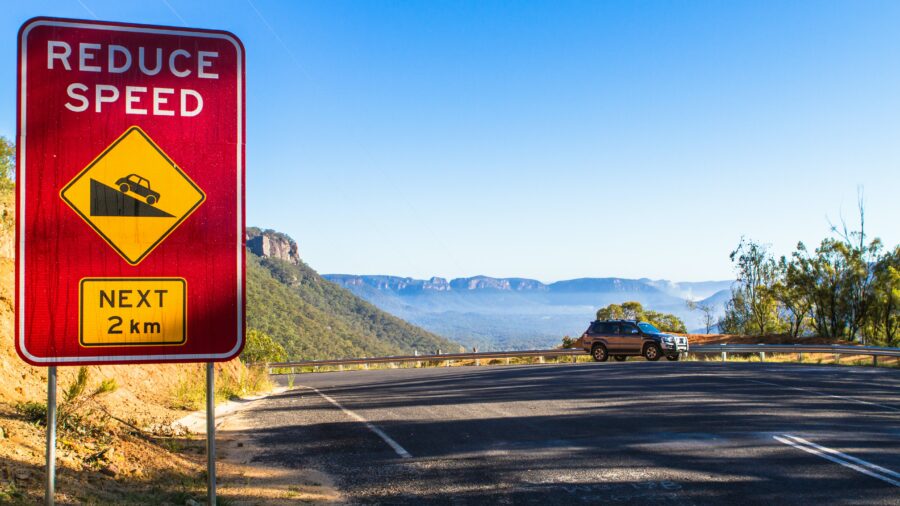
Our road safety record has been improving in the last 10 years. But it’s still not enough. The National Road Safety Strategy 2021-30 aims to reduce deaths each year by 50% and serious injuries by 30% by 2030. How will we do that?
Fewer road deaths in Australia
In the last 10 years, according to BITRE, Australian road safety has improved. The national trend for road deaths fell 0.5% each year in the past 10 years.
This trend for better road safety means more when put into context:
- More people on the roads – Australia’s population increased from 23.1 million to 26 million (12.4%). Yet death rates per population declined from 5.1 to 4.6.
- More vulnerable road users – The greatest increases were in age groups 65-74 (+31%) and over 75 years (+35%). Vulnerable road users are more likely to die or be injured.
- More cars on the roads – Vehicle registrations increased by 20.4% but the death rate per 10,000 registered vehicles fell 2.9% each year in Australia.
Fewer road deaths in NSW
In the last 10 years, the number of road deaths in NSW fell by around 2% each year.
This is the NSW context for better road safety:
- More people – The population increased by 10.2% but the NSW death rate per population reduced by 20.1%.
- More vehicle registrations – Vehicle registrations increased but the death rate per 10,000 vehicles fell 4.3% each year.
While NSW is not on track to meet the Towards Zero target, its road safety metrics are trending upwards.
What are the causes of road trauma?
The monthly Transport for NSW report of fatal crashes in July 2023 shows 36% of fatal crashes were directly caused by speeding. This means nearly two thirds (64%) were not speed related. So what were the causes?
Victoria’s Traffic Accident Commission (TAC) said 71% of all fatal accidents since 2017 were caused by basic errors of judgement, rather than “high-risk behaviours” (eg, speeding and drug or drink driving).
UK police state similar reasons for fatal accidents:
- The biggest cause of road deaths is poor observation.
- Second is ‘loss of control’.
- Third are equally driver carelessness and excess speed.
Interestingly, the UK sees around 1,500 road deaths each year – for a population of 60 million. Police currently record fewer than 400 as related to “excessive” speed.
Most speeding fines in NSW are for speeds that are not excessive. Meanwhile, TfNSW measures only “high-risk behaviours”: speed, alcohol, fatigue and seatbelts. Yet, distraction, fatigue, incompetent driving and dangerous vehicles are also involved in road deaths.
What the National Road Safety Strategy wants
All Australian governments have adopted Vision Zero – zero deaths and serious injuries by 2050.
However, the latest National Road Safety Strategy 2021-30 aims to reduce deaths each year by 50% and serious injuries by 30% by 2030. It has 3 themes – safe roads, safe road use and safe vehicles.
Safe road use
The main focus of safe road use seems to be reducing indicators of risky road use:
- Drivers under the influence of drugs or alcohol
- Vehicles travelling above the speed limit
- Drivers using a mobile phone or device
- Occupants not wearing seatbelts.
Perhaps there could be more focus for better road safety on education and encouragement as well as on enforcement. Some say Australians could improve their driving skills with a more rigorous driving test.
German learner drivers have to go to a driving school, pass a theory and practical test (urban, autobahn and night) and take a first aid course . This can cost up to $5,000.
In fact, more Australians as a percentage of the population die on the roads than in Germany or the UK:
- 1,194 (0.005% of 26 million) Australians died in 2022.
- 2,782 (0.003% of 84 million) Germans died in road accidents in 2022.
- 1,500 (0.0025% of 60 million) Britons die on the roads every year.
These countries have higher speed limits than Australia.
Safe roads
Why is the Australian rate of deaths higher than in Germany or the UK? Some blame driving skills. Others blame driving conditions – long distances on rural roads, potholes, ragged edges, poor lighting. There never seems to be enough funding for the 680,000 kilometres of roads in Australia.
But does it make sense to blame a road when a good driver always drives to the conditions of the road?
Safe vehicles
Meanwhile, there are no incentives “to choose the safest vehicle within their price range” (safe vehicles) . In fact, current incentives are to buy electric cars, which are more unaffordable than most cars. There are no incentives to put younger people in newer cars, even though they are the ones most in danger when they first start driving unaccompanied.
Fortunately, there is one incentive – a driver with a safe vehicle and a safe driving record can get cheaper green slips.


your opinion matters: