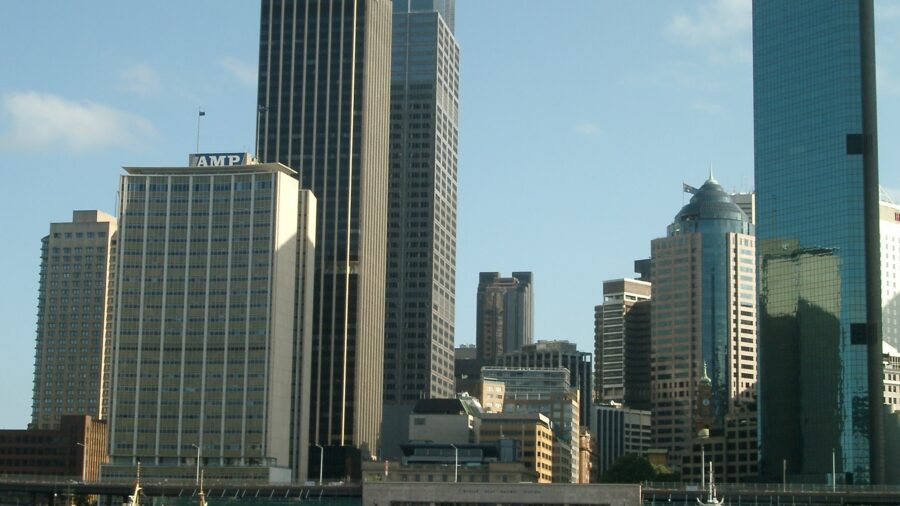
The current tolling arrangement for the Sydney Harbour Tunnel ends 31 August 2022. What will happen to tolls now the Western Harbour Tunnel is being built? Perhaps it’s time to stop addressing individual tolls and start looking at the whole network.
How to toll the harbour crossings
After 30 years, the tolling arrangement for the Harbour Tunnel ends 31 August. Currently, tolls are payable when travelling southbound only. That toll will continue from 1 September but revenue from the Harbour Tunnel toll will go to the NSW government.
The government views any new Harbour Tunnel toll through the lens of the new Western Harbour Tunnel, now due to open in 2028. If it’s free to use the Harbour Tunnel northbound then it must be free to use the Western Harbour Tunnel northbound. One mooted alternative is to split the same toll over both directions.
It is not known how far the government wants to involve the private sector in this decision. Transurban has stated it wants to buy the new Western Harbour Tunnel and the Sydney Harbour Tunnel. Currently, the company will own 13 of 15 toll roads when the last stage of WestConnex opens in 2023.
Motorists in Sydney paid more than $2 billion in tolls in 2020-21.
Who pays the most tolls?
Sydney residents pay the most tolls in Australia. More than half of Australia’s tolled roads are in Sydney, even though only a fifth of the nation’s population live there.
However, a high proportion of motorists in Western Sydney are paying these tolls. Residents in Western Sydney pay tolls because they live further from the CBD or Parramatta and have less access to public transport. Some 85% of postcodes where drivers are eligible for toll relief are in Western Sydney.
Some suburbs are disproportionately hit by tolls. A 2020 study of toll spending in Sydney LGAs identified seven councils where the highest 10% of toll-paying households spent over $6,000 a year for tolls. These include Woollahra, Burwood, Lane Cove, Hornsby and Liverpool. These drivers may be more time sensitive than price sensitive.
However, those living in the south-west were paying more than twice what people paid in inner-metro areas. For example, Camden spends the most each year on tolls ($793) but Northern Beaches spends only $354.
Is the current toll regime fair?
Infrastructure Australia says the current patchwork of tolls places unfair weight on some drivers and doesn’t price the whole network efficiently. IA says the price should reflect the cost of the whole journey, not the cost of any particular road.
How would a new toll regime work?
- A distance-based model for the whole network
- Different tolls per kilometre for eastern, central, and western zones of Sydney
- Off-peak discounts to encourage passenger cars, vans and trucks.
IA says total tolls would be distributed differently but should be no higher than they are now.
Meanwhile, the NSW Legislative Council’s Report from the Inquiry into Road Tolling Regimes is completed, with a government reponse due in November 2022.
The cost of trips (April 2022 prices)
We have calculated the rising cost of the same five trips in Sydney since May 2017. Tolls go up every quarter by an agreed amount, except the harbour crossings. We now include the weekly toll as well as the daily toll. The weekly toll is $200 or more for four of the trips.
| Liverpool to City | Glendenning to City | Penrith to Airport via M5 | Wahroonga to Airport | Cremorne to Katoomba | |
| Toll there | $27.34 | $22.25 | $21.17 | $10.09 | $22.46 |
| Toll back | $12.55 | $18.25 | $20.03 | $16.49 | $22.46 |
| Daily toll | $39.89 | $40.50 | $41.20 | $26.58 |
$44.92 |
| Weekly toll | $199.45 | $202.50 | $206.00 | $132.90 |
$224.60 |
Source: Sydney Motorway Toll Calculator. State the entry and exit points or locate them on a map. Some entry points do not operate as exit points and vice versa.


your opinion matters: